The proper function and control of DNA replication is critical for cell proliferation and genomic integrity. During this highly complex process, numerous different proteins work together in the replisome. Despite the large body of knowledge surrounding the composition of the replisome and the function of DNA replication, many questions regarding the details of the mechanism remain open. To truly uncover how the individual proteins assemble and interact together to perform the successful replication of the large genome, dynamic single-molecule technology is deciding.
C-Trap® Optical Tweezers – Fluorescence & Label-free Microscopy provides the unique possibility to visualize single proteins in real-time, assemble the replisome step-by-step, and manipulate the biological system. These capabilities will empower your research to gather valuable insights into the detailed mechanisms governing DNA replication.
Direct visualization and quantification of ORC dynamics at the single-molecule level
The combination of optical tweezers with fluorescence microscopy and the high spatial resolution of the system enables scientists to directly observe and map the dynamics of DNA-binding proteins along a single DNA molecule. With these data, scientists can quantify the dynamic movement and draw conclusions on the mechanism of the observed entities. Prof. Nynke Dekker and her team used these features to uncover the dynamics of initial replisome formation for DNA replication.
In yeast, the origin recognition complex (ORC) recognizes specific DNA sequences (i.e., origin) and initiates the starting point for DNA replication. In this experiment, Sanchez et al. engineered a DNA sequence with an artificial origin binding site. They tethered a single DNA molecule to two optically trapped beads and observed the motion of ORC on the DNA in real-time.
Tracking the movement of ORC (Figure 1a and b) showed that the dynamics vary depending on the location at which ORC initially binds to DNA. Calculating the diffusion constants and fitting them based on the initially bound DNA locations (Figure 2) clearly displayed two motion groups: When ORC binds to the origin sequence, it remains in its position (Figure 1 a). But when ORC binds to non-specific DNA sequence, it moves linearly performing a target search for origin (Figure 1 b), where it halts its movement. This probably allows recruitment of further replisome components at the preferred location.
The high spatial resolution of the C-Trap system allowed to map the location of ORC binding on DNA and the high time resolution allowed tracking its motion. These novel observations created insights into how the dynamics of individual proteins contribute to replisome formation.
Figure 1 Samples of tracking data (i) and confocal images (ii) illustrating dynamics of ORC initially bound within the origin sequence (a) or at a non-specific location (b).
Figure 2 Histogram of calculated diffusion constants of ORC fitted to log-normal distributions (solid black line).
Manipulation of DNA structure and visualization of ssDNA formation
The C-Trap provides a fully correlated system combining fluorescence microscopy and optical tweezers. This allows to manipulate DNA structure while simultaneously observing fluorescence signal and measuring force response. In this experiment, double-stranded DNA (dsDNA) is melted into single-stranded DNA (ssDNA) using force-extension, while the interplay of dsDNA and ssDNA fluorescent markers with the changing structure of the DNA is observed.
Sytox orange is a DNA intercalator that is known to bind to dsDNA, whereby RPA is known to specifically interact with ssDNA only. During DNA replication, RPA binds to unwound DNA and stabilizes it against reannealing with its complementary strand, thus keeping the DNA strand open for the polymerase to replicate it (in the subsequent stages of the replication process).
Here, dsDNA was extended at a constant velocity of 140 nm/s while at the same time force, distance, and fluorescence signals were recorded continuously (Figure 3). By overlapping these data sets, we see that as the end-to-end distance (grey line) increases, Sytox molecules (green) bind between the base pairs of dsDNA. Stretching the DNA even further initiates DNA melting and the formation of ssDNA, which can be seen both globally by a drop in the force (red), and locally by the visualization of the ssDNA binding protein RPA (blue).
The unique features of the multiple correlated techniques within the C-Trap enabled manipulating the structure of DNA, while visually observing its unwinding and the subsequent stabilization by RPA in real-time. This allows to study the effect of DNA structure on the behavior of DNA-binding proteins and ultimately displays the true correlation of the molecular process with physical parameters.
Figure 3 Dual-color fluorescence kymograph corresponding to dsDNA structure (bound Sytox Orange molecules; green) and ssDNA structure (bound RPA molecules; blue). Overlapped are the end-to-end distance (grey line) of the tethered DNA strand and force data (red) showing the true correlation of the data sets.
Real-time observation of DNA exonuclease dynamics at base-pair level
The high spatial sensitivity of the C-Trap/m-Trap optical tweezers systems makes it possible to measure changes in DNA length at the nanometer level. This capability can be used to indirectly measure the activity of enzymes as they process DNA molecules.
In this experiment, the exonuclease activity of the T7 DNA polymerase was investigated. For this, an optically trapped double-stranded DNA was held at a constant force that induced exonucleolytic activity of the polymerase. By removing nucleotide after nucleotide from one strand, the polymerase was unwinding the dsDNA. As the length of single-stranded DNA is longer compared to its double-stranded state, the unwinding resulted in a gradual increase in the end-to-end distance of the DNA (Figure 4). This change in length was directly translated into the activity of the T7 DNA polymerase and the number of nucleotides it processed over time (Figure 5). Specifically, short activity bursts ranging between 3 and 10 nucleotides were revealed, interspersed by frequent pauses of varying duration. This provided deeper insights into the dynamics of T7 exonuclease activity.
The m-Trap and C-Trap Optical Tweezer systems are highly valuable in providing novel insights into the mechanism of DNA-processing enzymes, as they enable performing single-molecule measurements of the stepping behavior of biomolecular motors along nucleic acids.
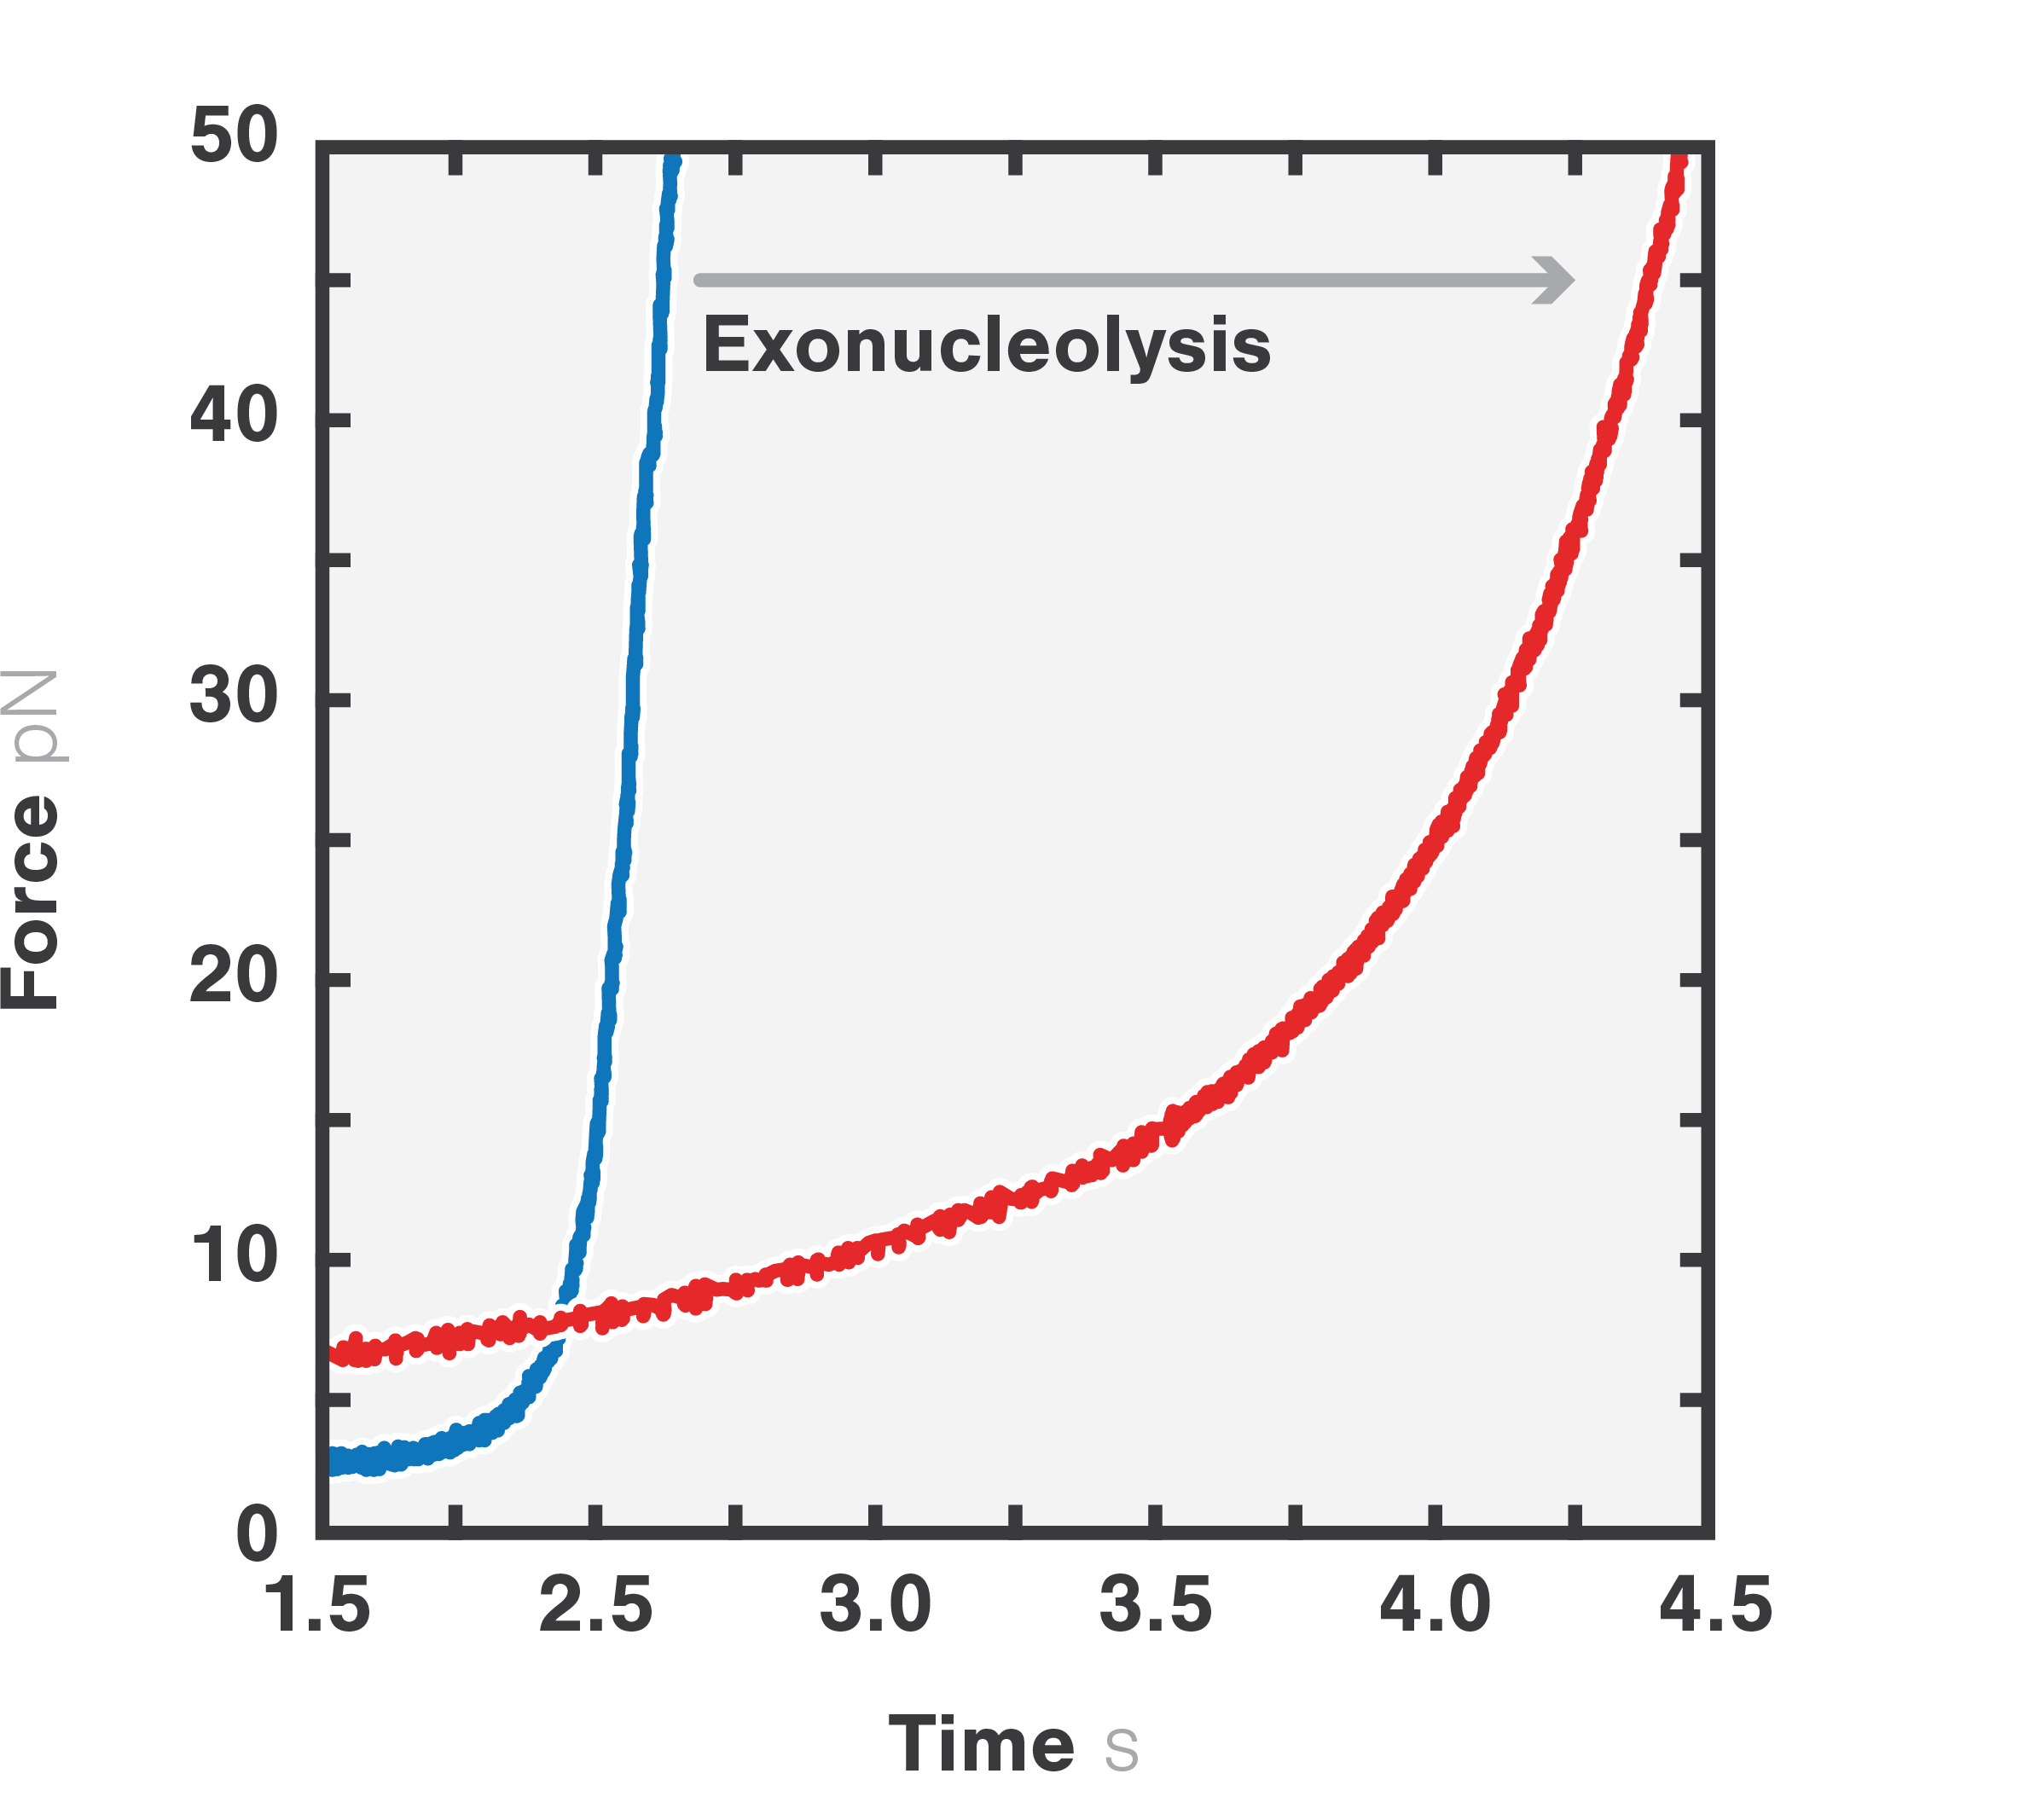
Figure 4 Force-distance curve of double-stranded DNA (blue) and single-stranded DNA (red).
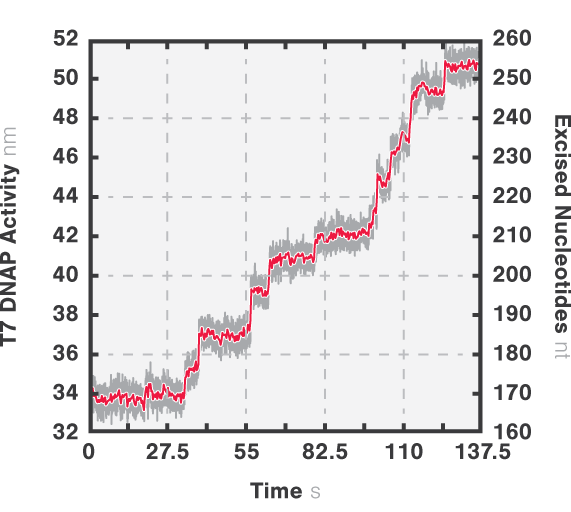
Figure 5 Activity bursts of T7 DNA polymerase performing force-induced exonucleolysis on a double-stranded DNA.