Force extension, manipulation, and visualization of DNA overstretching
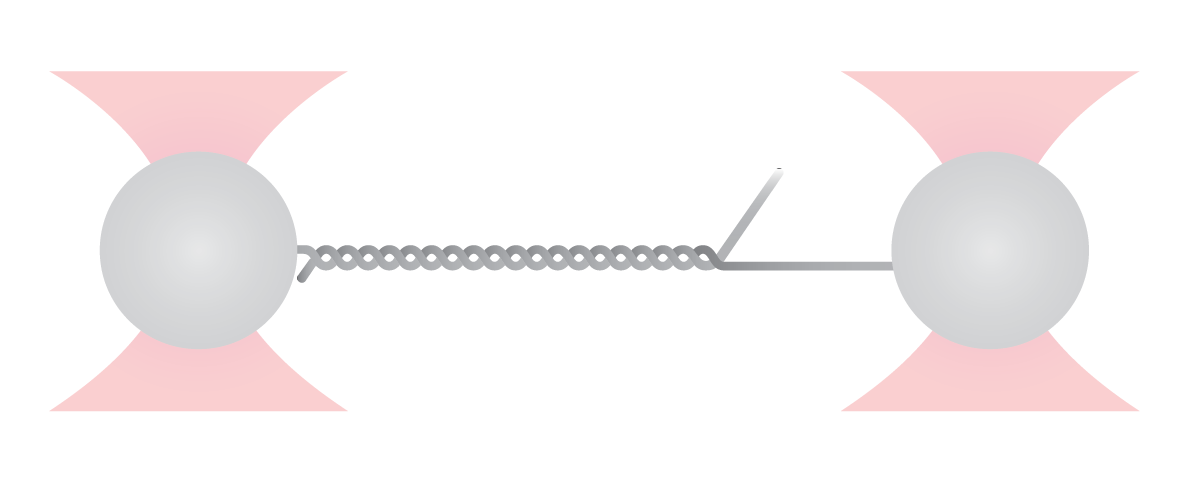
Here, a single double-stranded DNA (dsDNA) molecule is tethered between two beads and incubated with Sytox Orange, a dsDNA fluorescent marker, and fluorescently labeled replication protein A (RPA), an ssDNA-binding replication protein.
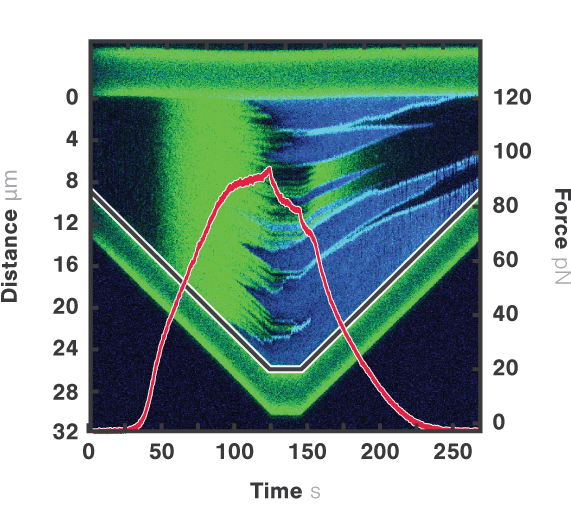
Figure 1 shows a dsDNA molecule being stretched with a constant velocity of 140 nm/s while at the same time force, distance, and fluorescence signals are continuously recorded. By overlapping all data sets, we can see that as the end-to-end distance (grey) increases, Sytox molecules (green) bind between the base pairs of dsDNA. Stretching the DNA even further initiates DNA melting and the formation of single-stranded DNA (ssDNA), which can be seen both globally by a drop in the force (red), and locally by the visualization of the ssDNA binding protein RPA (blue).
As soon as RPA begins binding we can observe a drop in the force signal, indicating the stabilization of melted DNA, which – being coated by RPA – cannot be reannealed with its complementary strand to form dsDNA again. This keeps DNA unwound for the polymerase to replicate it in the subsequent stages of the replication process. Finally, relaxing the molecule back to less than 25 pN results in Sytox Orange dissociation while RPA remained bound.
1 Dual-color fluorescence kymograph corresponding to the extension and retraction of a single dsDNA. End-to-end distance (grey) and force (red) data sets are overlapped to the fluorescent image showing the true correlation of the data sets.
Real-time observation of DNA “breathing”
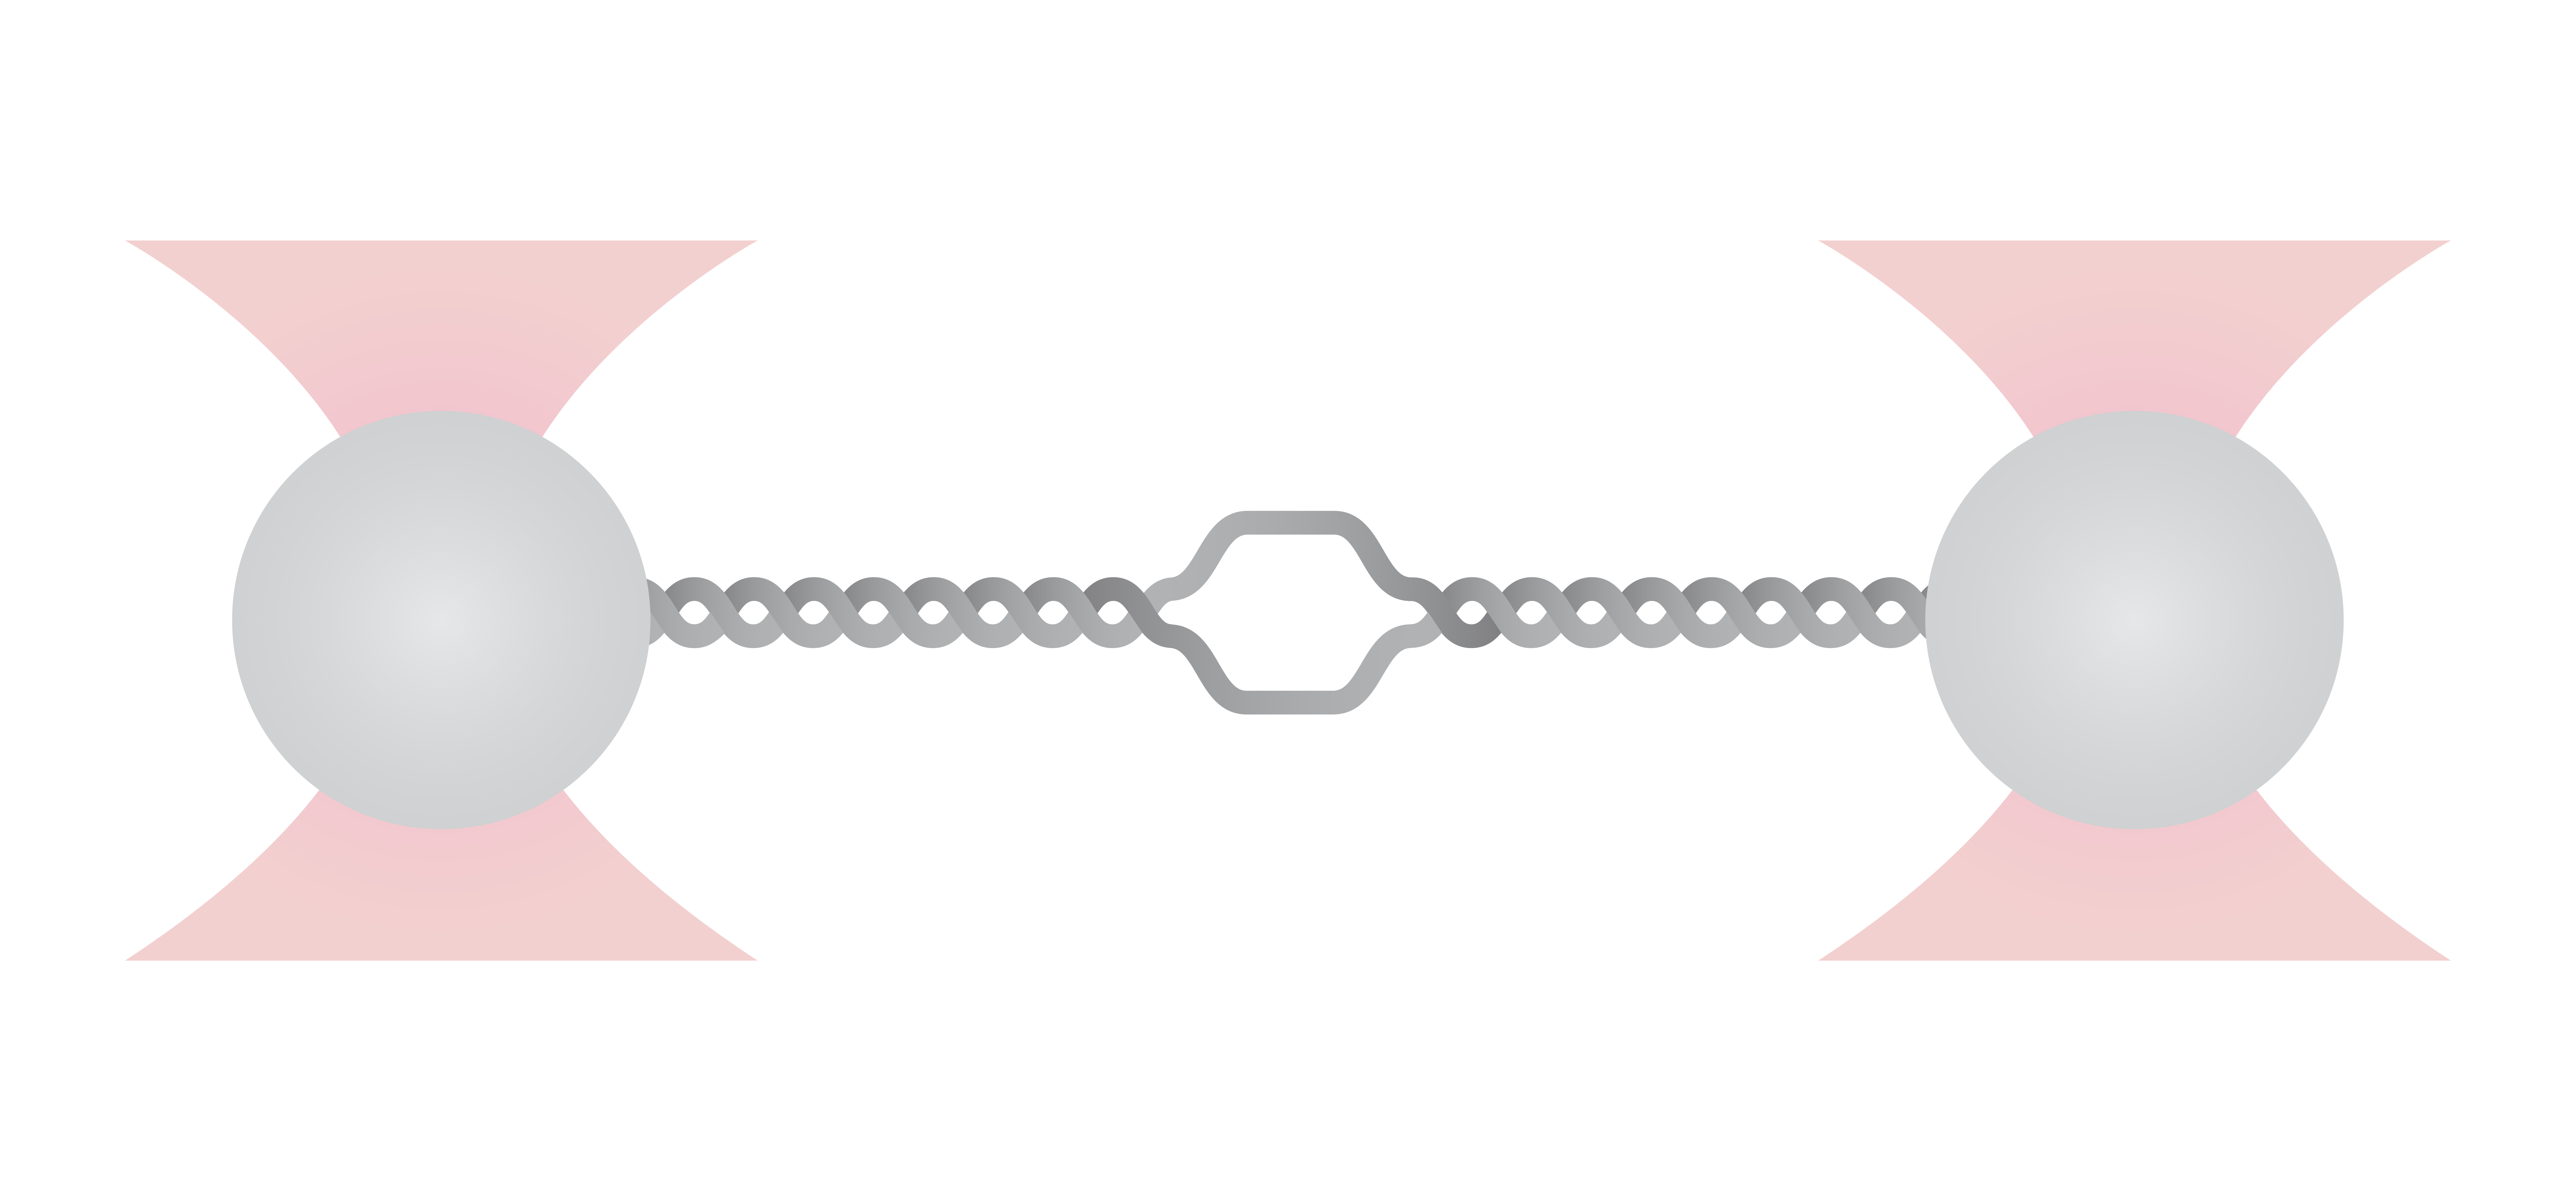
In this experiment, a dsDNA molecule is caught and tethered between two beads. By maintaining the end-to-end distance constant over time, we observed fluctuations in the recorded force signal. These fluctuations revealed DNA breathing, or DNA fraying, a phenomenon describing the local conformational transitions occurring within dsDNA, when base pairs break spontaneously without requiring any external energy source.
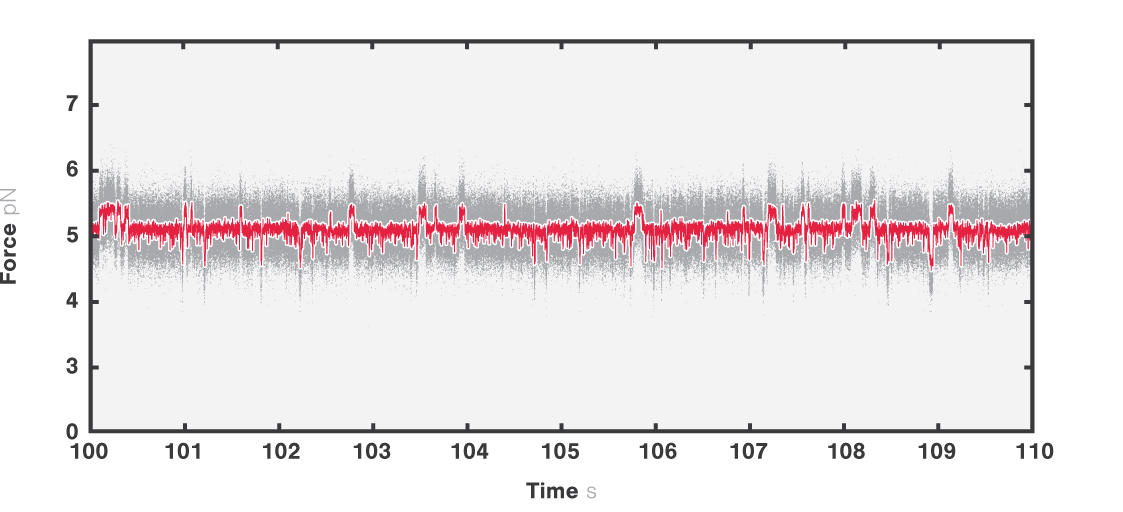
Figure 2 shows the results of an experiment where we held the DNA molecule at a constant distance to reveal spontaneous conformational transitions occurring within the molecule over time. Under these conditions, we were able to monitor this phenomenon stably for well over 10 minutes without altering the transition kinetics. From the 10 s inset of the complete trace shown in the figure, we can distinguish fast transitions between multiple states.
In fact, when we performed histogram analysis over the full trace (Figure 3), we were able to resolve up to 4 states displaying DNA breathing, each corresponding to up to 60 base pairs.
2 Ten second fragment of force trace recorded over 520 seconds corresponding to a single dsDNA molecule (8.4 kbp) held at a constant distance using optically-trapped polystyrene beads (Ø= 0.8 μm). The trap stiffness was set to 500 pN/µm. Data was recorded at 50 kHz (gray) and decimated to 1000 Hz (red)
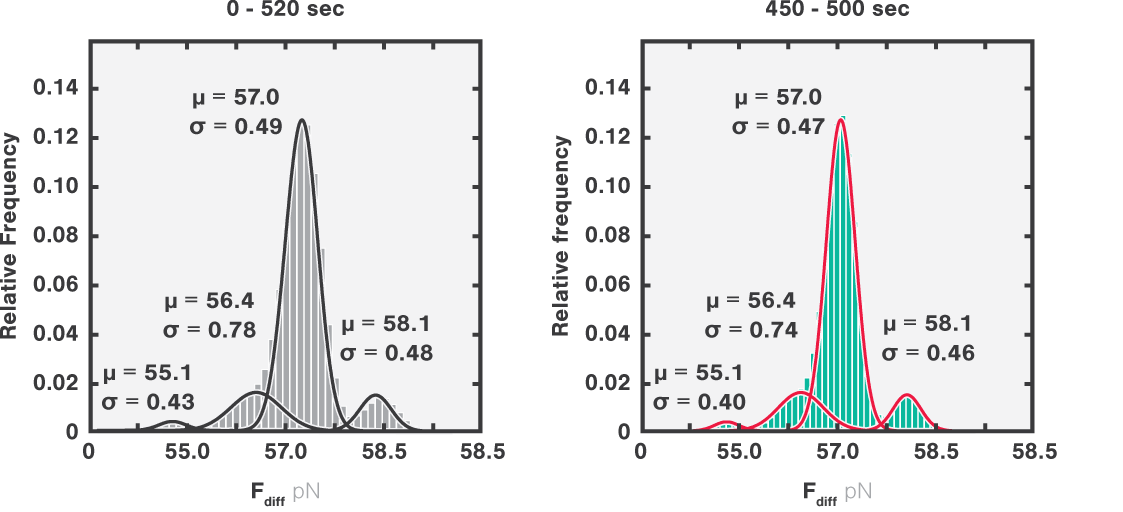
3 Histograms of the force values collected for the full trace (left) and during a fragment of 50 seconds (right). The mean and sigma values are reported for each peak obtained from a Gaussian fit.
Measurement of RNA structural mechanics and equilibrium dynamics
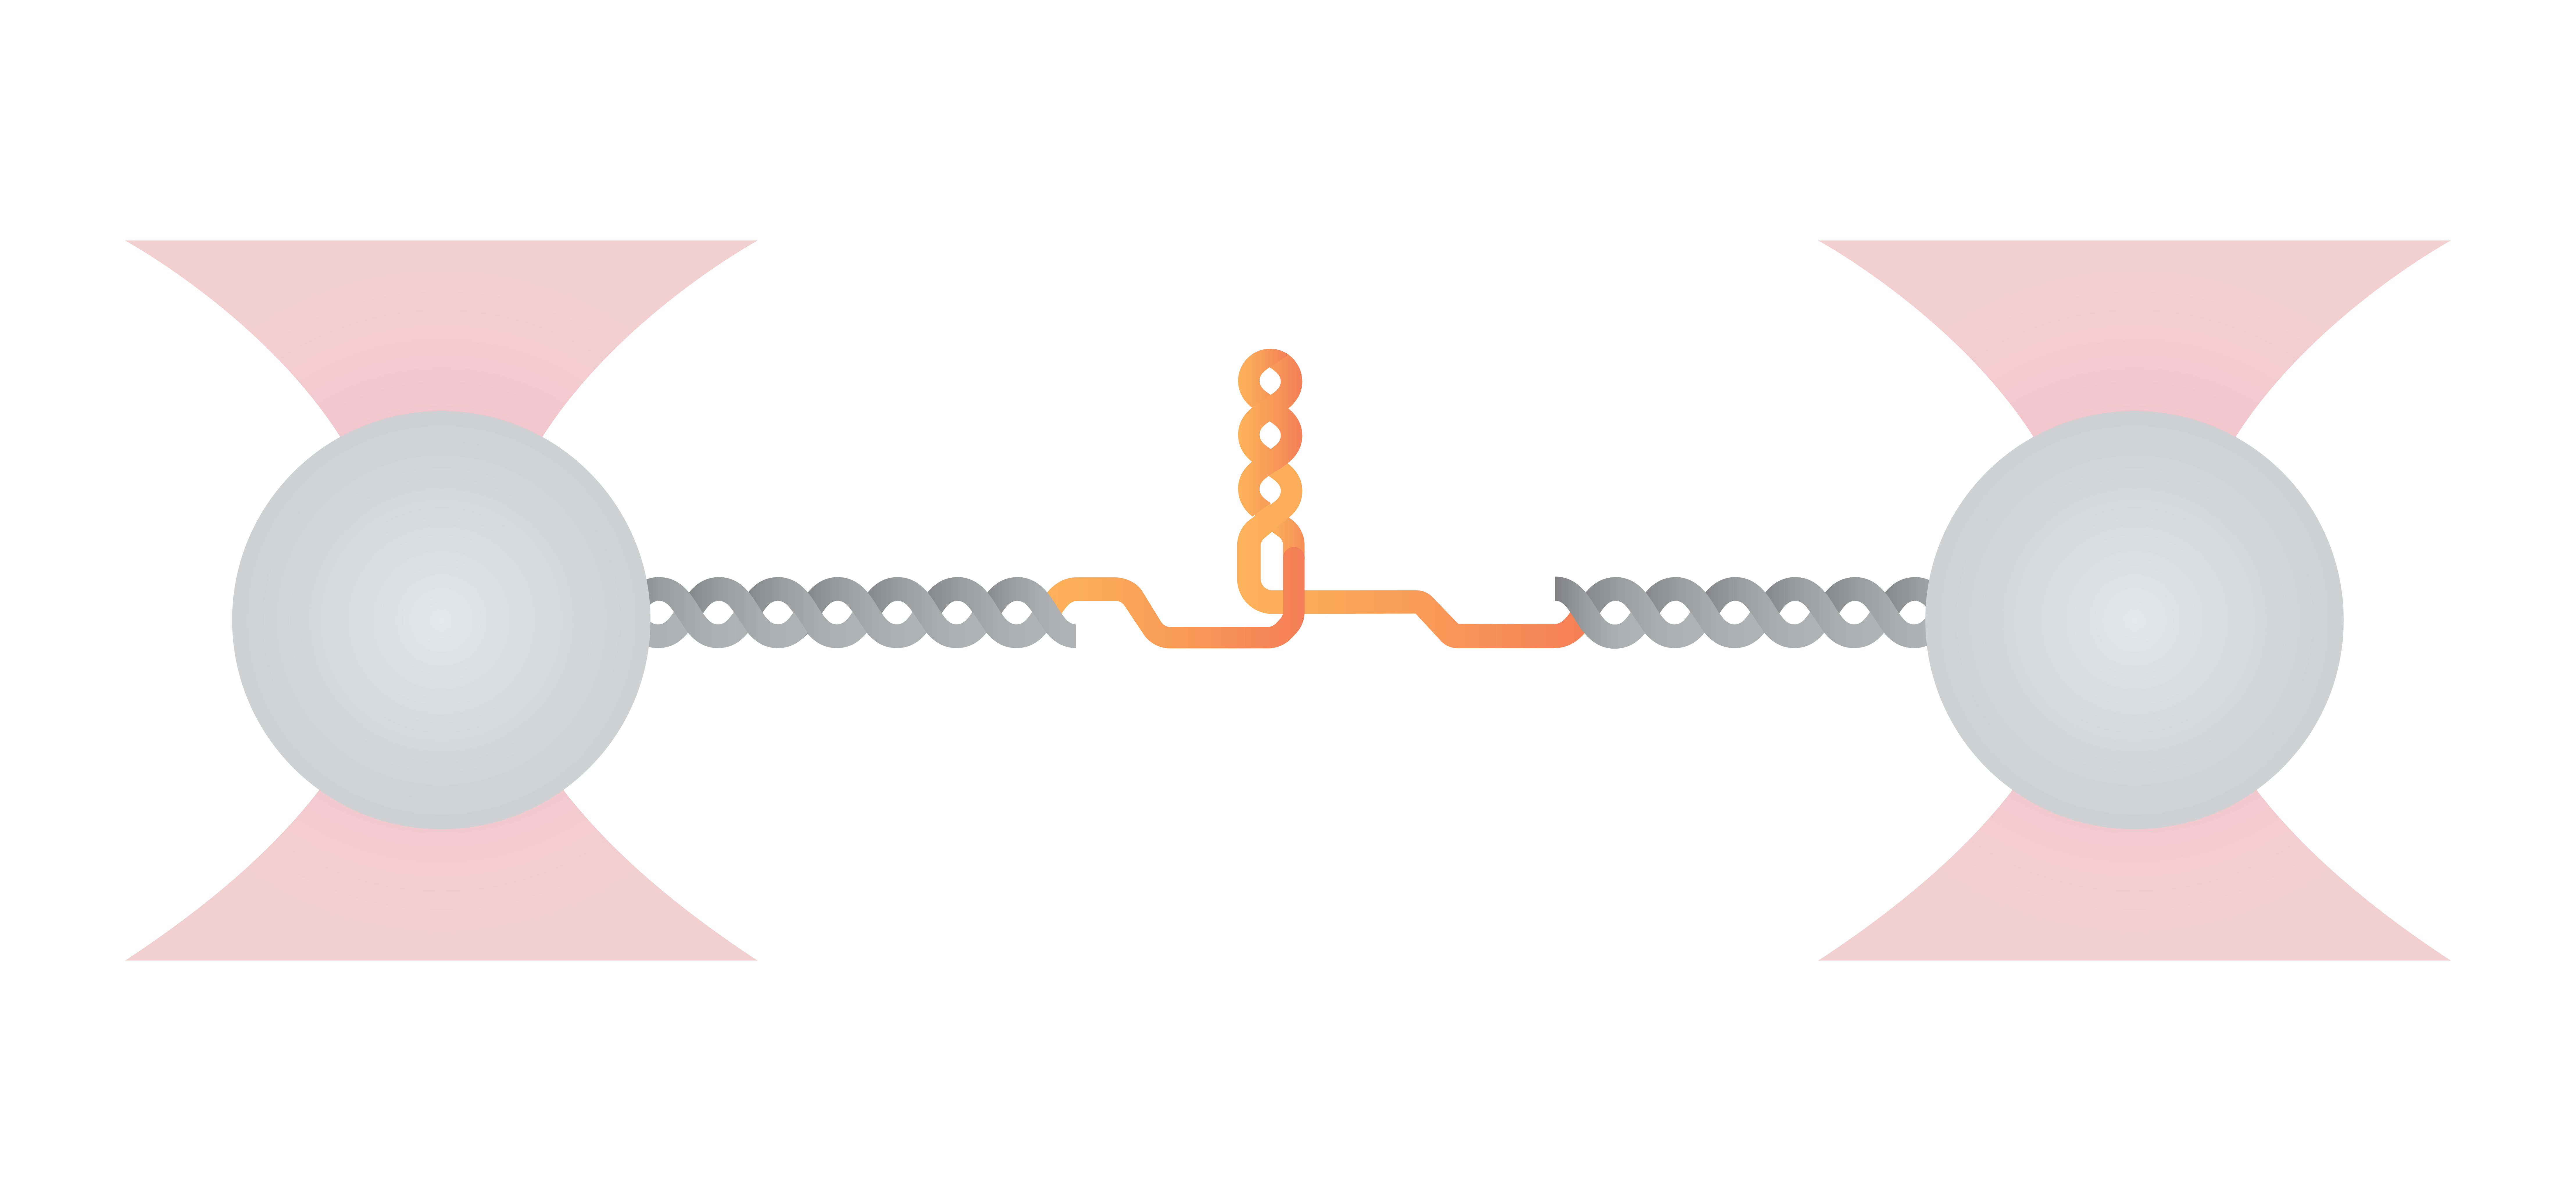
With the C-Trap we can study RNA dynamics and investigate the conformational changes of RNA molecules. Here, we tethered an RNA hairpin between two beads using two DNA/RNA hybrid handles. We then stretched and relaxed the RNA molecule with a constant load, while recording the force-extension curve to determine its mechanical and structural properties.
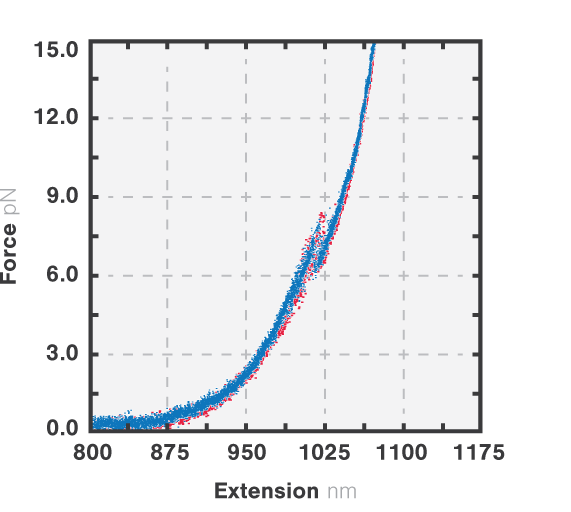
By looking at Figure 4, we can observe an unfolding rip at about 8 pN, approximately 15 nm long. When we relaxed the molecule, the refolding curve followed the same path as the unfolding, which corresponded to a rip of similar size, proving that the unfolding of the RNA molecule is a reversible process. Further study of the RNA equilibrium dynamics to evaluate the RNA structural transitions over time revealed two major states at tensions around 6.2 pN and 7.2 pN, while a third conformational state was also occasionally observed (Figure 5).
Force extension, manipulation and visualization of DNA-protein-DNA interactions
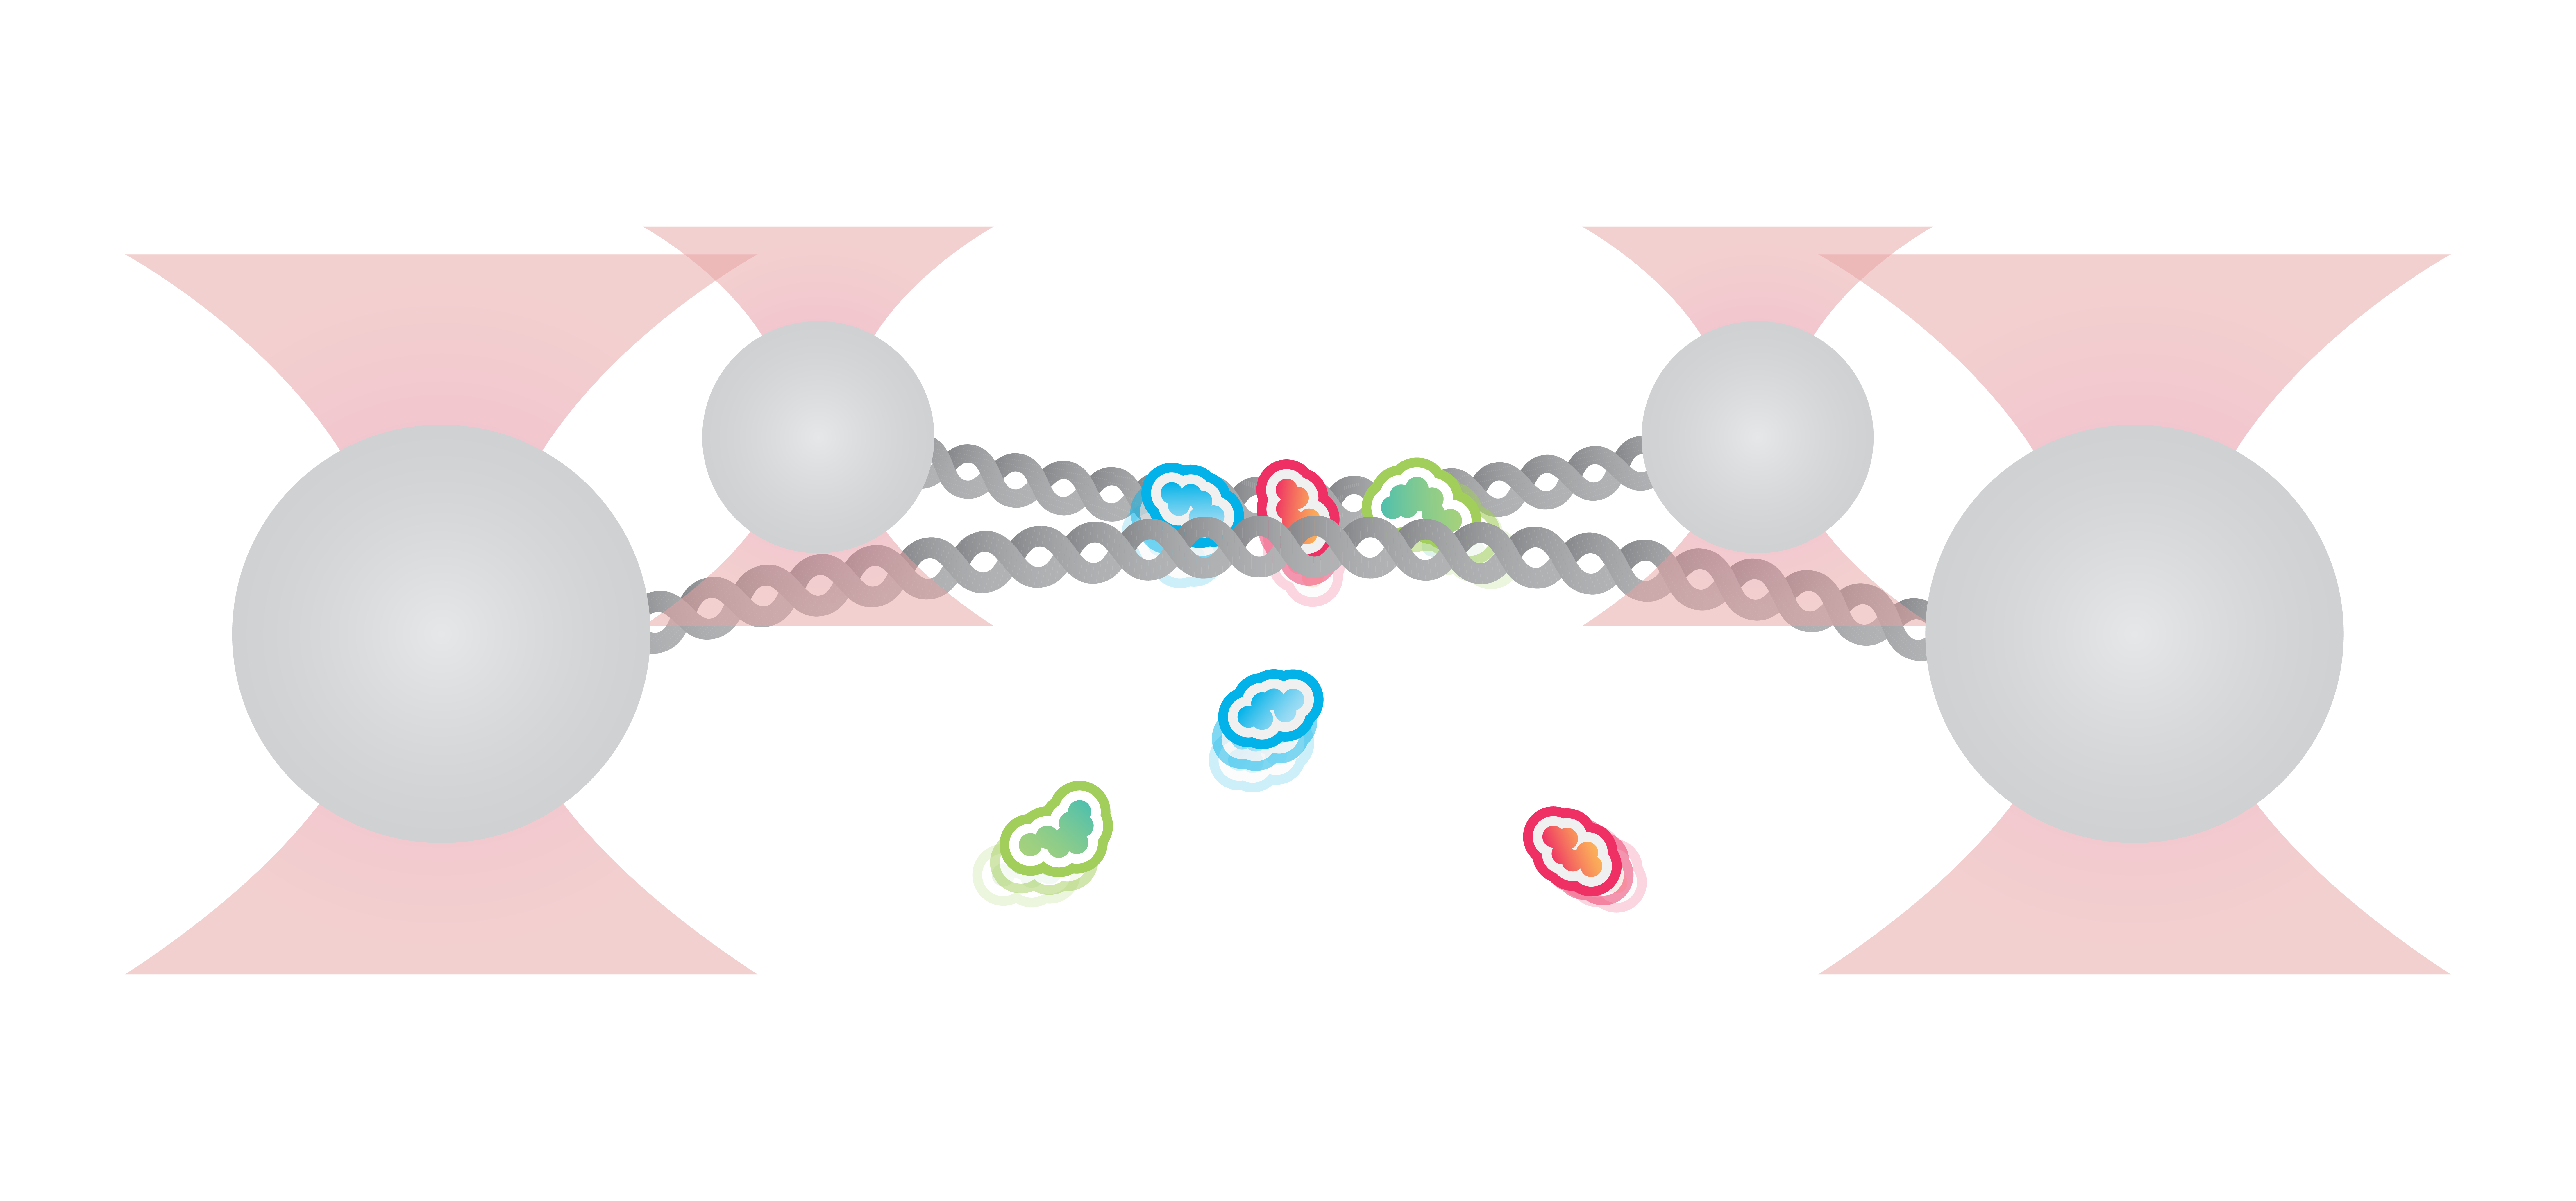
Here we use a quadruple trap configuration to trap beads and catch two DNA molecules in between. The two DNA molecules are held in close proximity in the presence of DNA bridging proteins. This allows for the study of complex DNA interactions involving multiple DNA molecules.
Figure 6 shows an example in which two DNA molecules are trapped using four optical traps and incubated with 200 nM of XRCC4 and 200 nM of XLF. As we increase the distance between the two trap pairs, we can observe the formation of protein bridges (orange), consisting of both XRCC4 (green) and XLF (red).
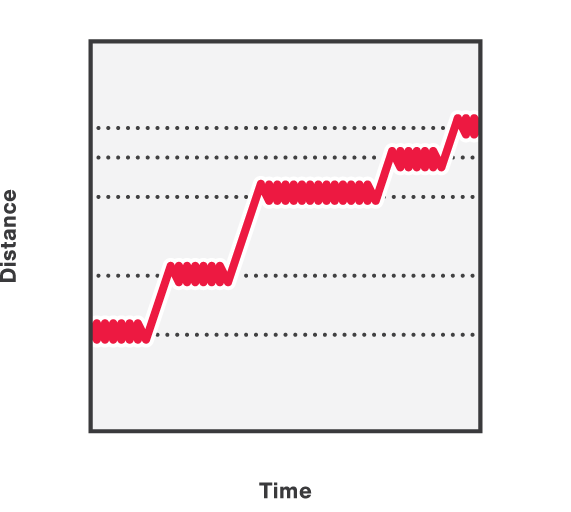
We can further manipulate the beads with force to further validate bridge stability and study the behavior of proteins under tension. In addition, by pulling on one bead, we can disrupt the bridges in a controlled manner resulting in a stepwise length (L) increase between the upper and lower beads (Figure 7). In the figure, the length increases shown are the result of disrupting DNA bridges by pulling on one side of the beads.
Brouwer et al. (2016) Nature

