Motor packaging activity and stepping
behavior with base pair resolution
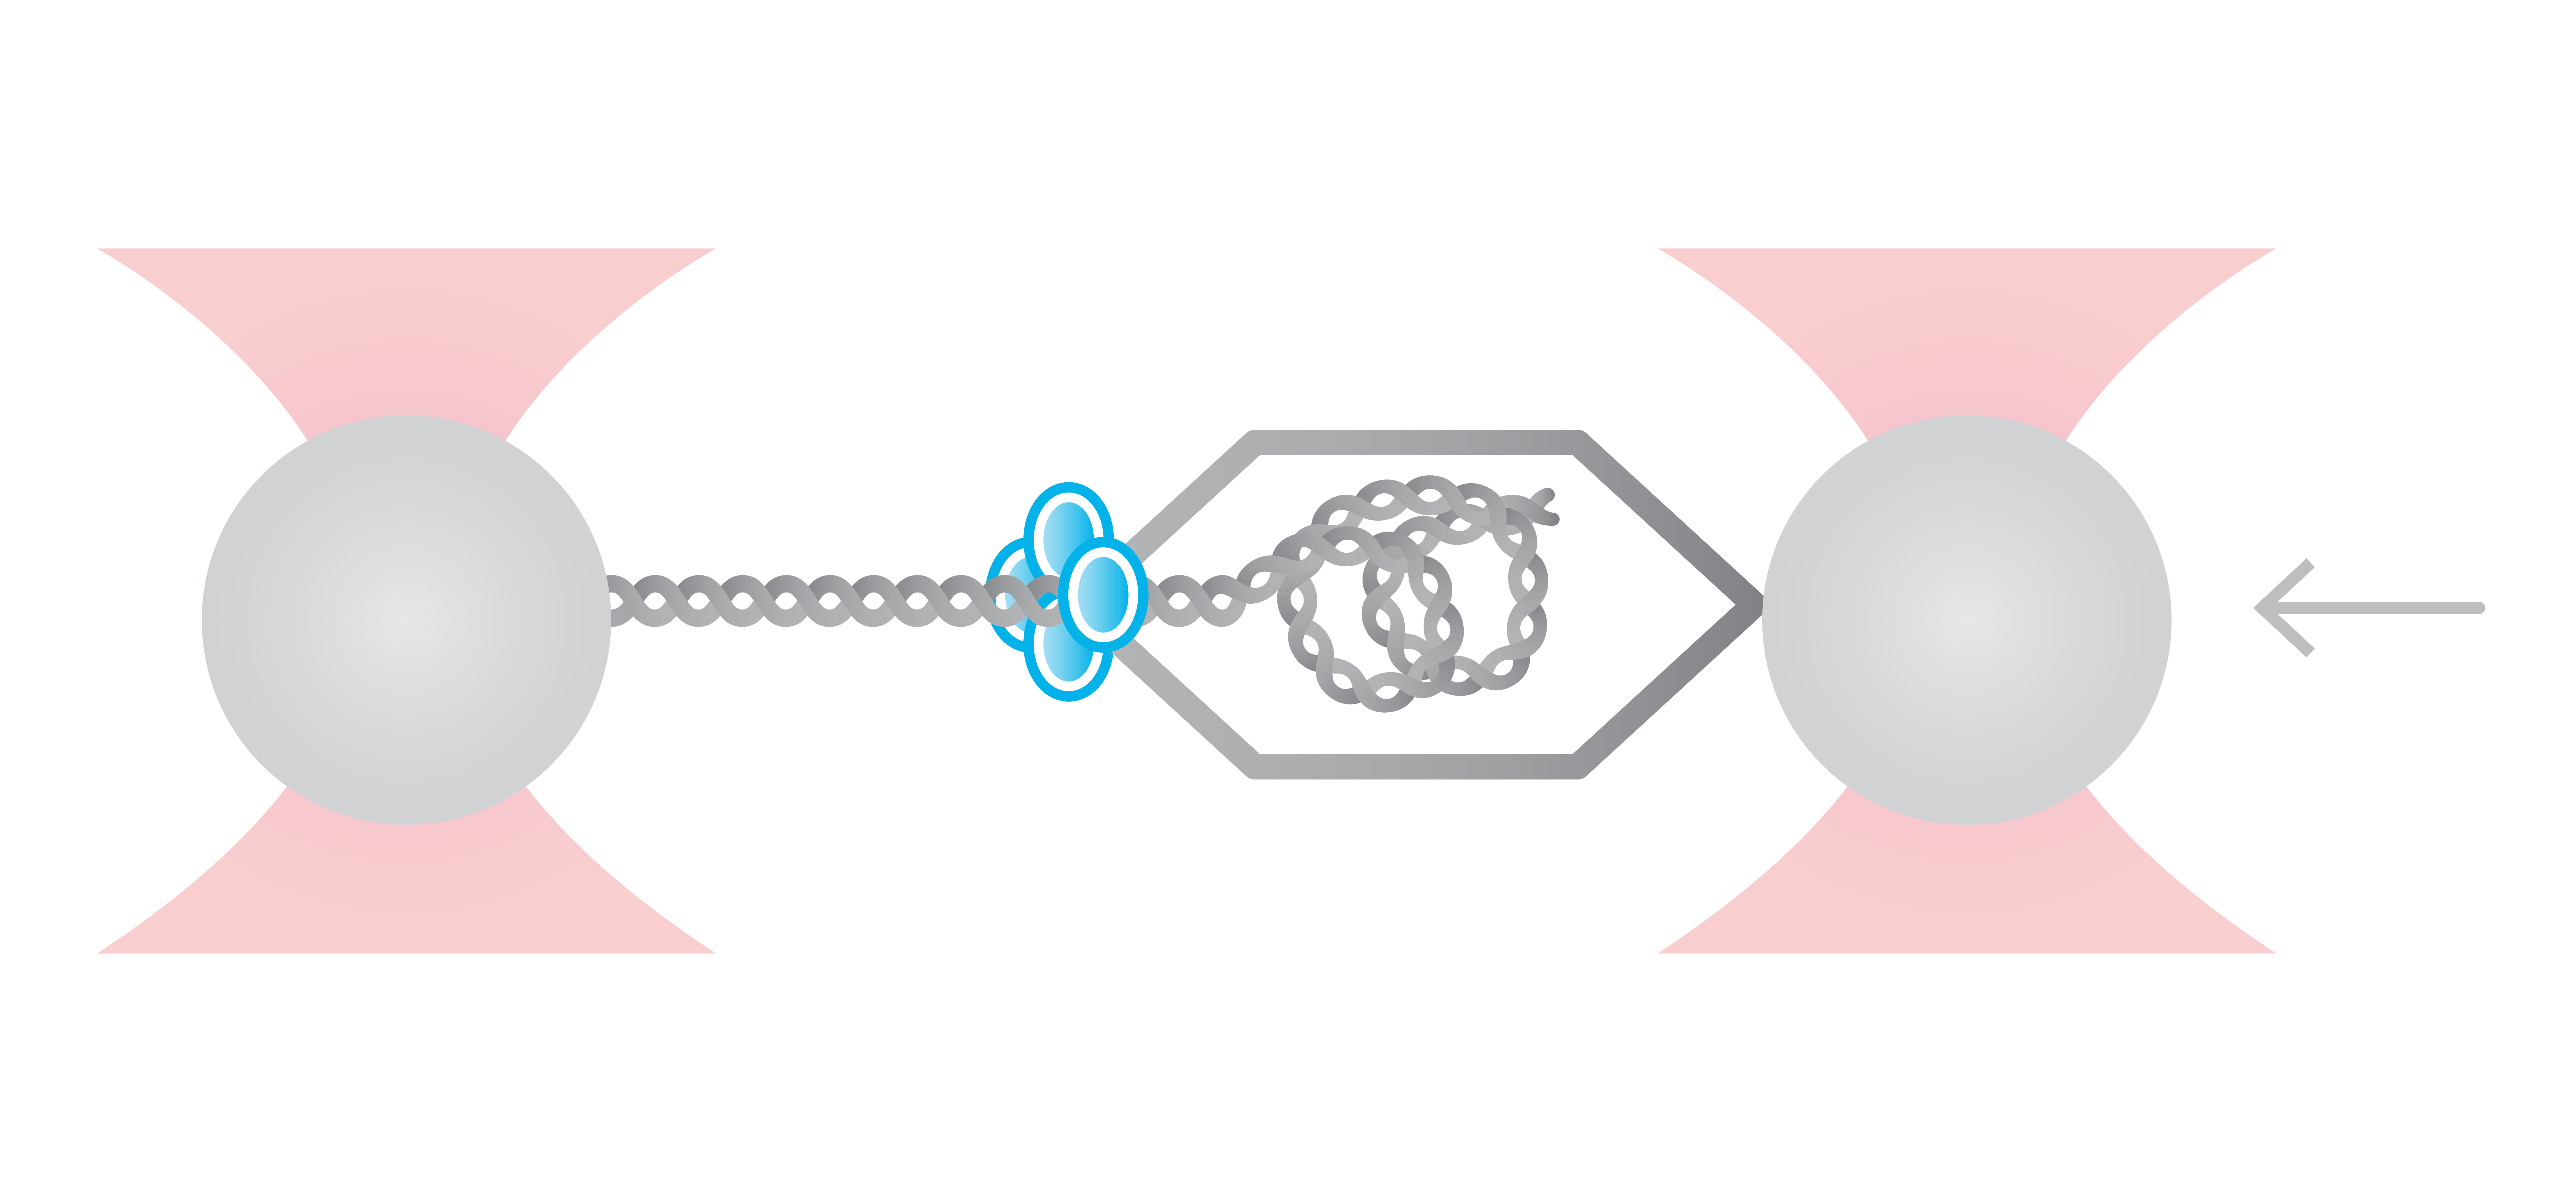
Here, we tethered a φ29 DNA packaging motor and its dsDNA substrate between two optically trapped beads. Using optical tweezers we can perform pulling and equilibrium experiments to probe the structural dynamics and conformational changes during genome packaging.
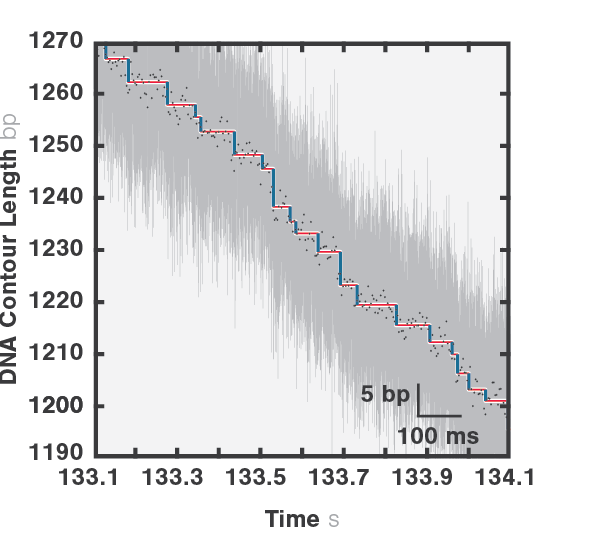
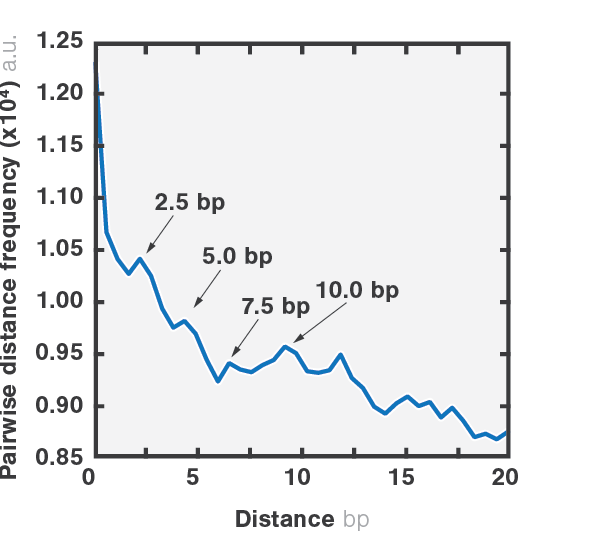
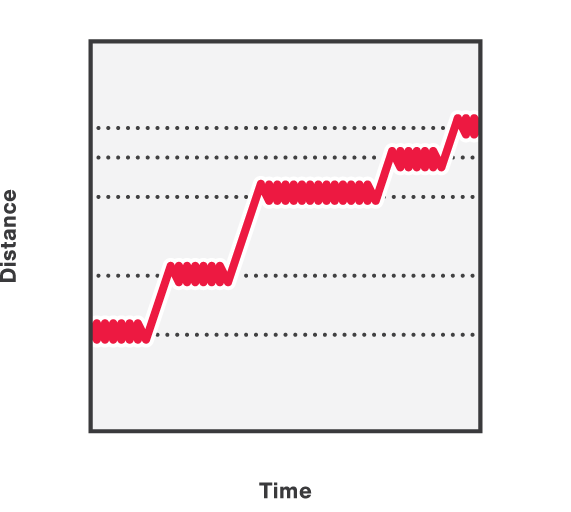
As packaging proceeds, the DNA contour length remaining outside the capsid decreases over time. By measuring the end-to-end distance between the two traps we can observe individual mechanochemical cycles of this molecular machine (Figures 1 and 2).
The duration of each cycle, as well as the amount of DNA packaged during each of them, provide meaningful information regarding the operation of the motor. Further data analysis provides mechanistic information on the underlying biological function.
Measurement of conformational changes
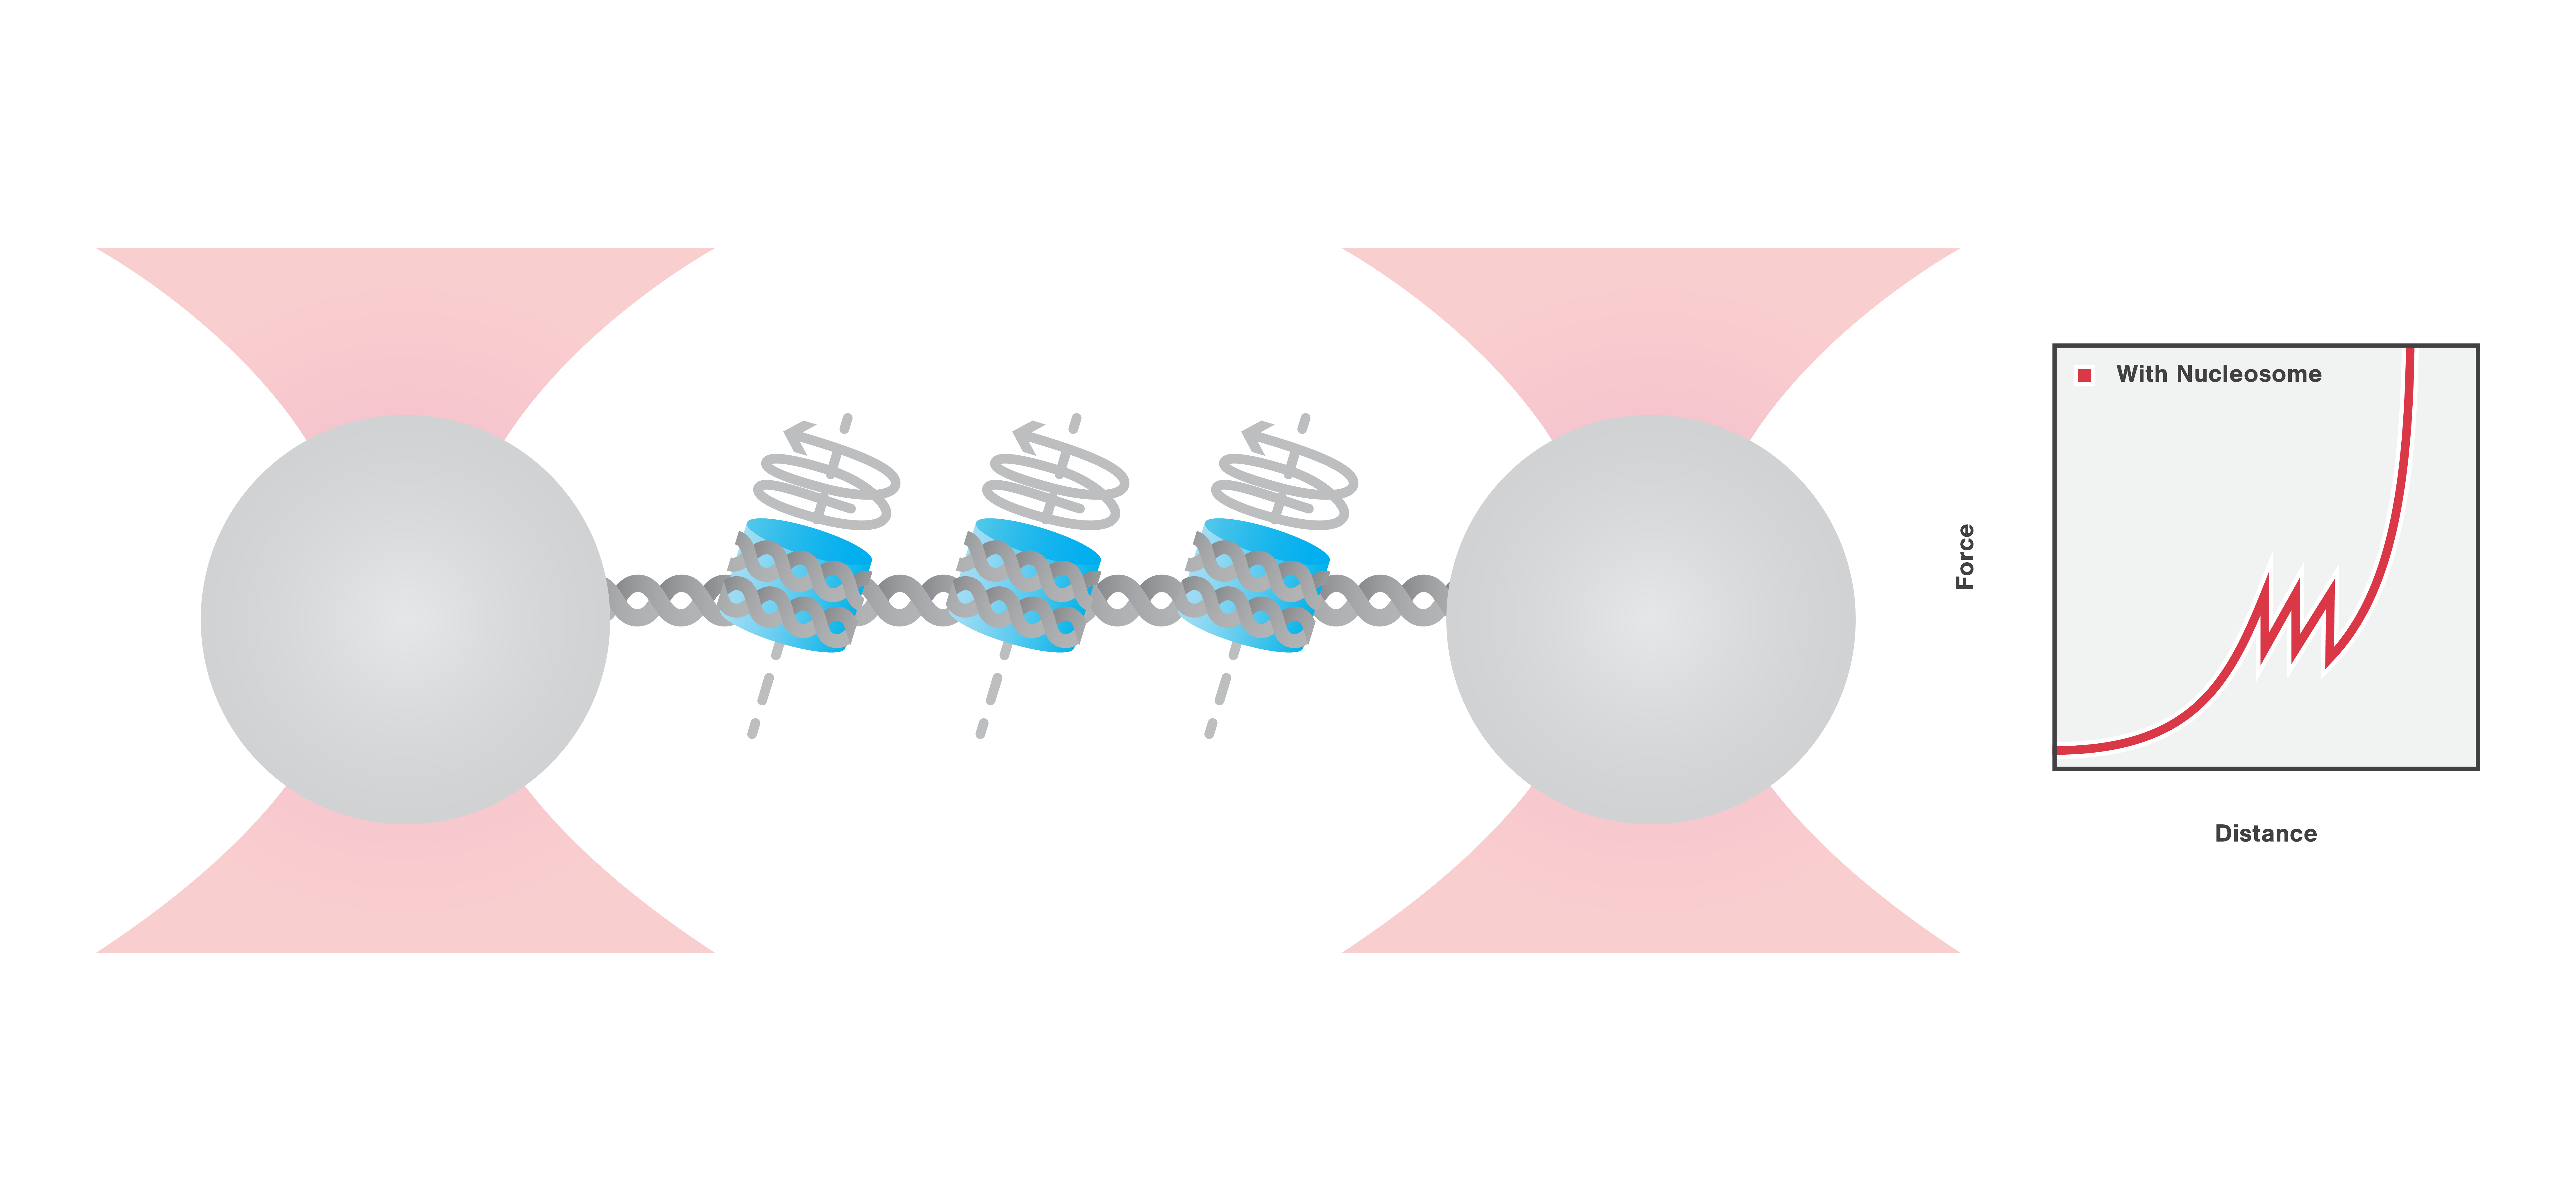
Here, we use optical tweezers to catch and tether a DNA molecule, organized in nucleosomes via DNA-histone complexes. Using optical tweezers we can perform pulling and equilibrium experiments to probe the structural dynamics and conformational changes of DNA packaging complexes.
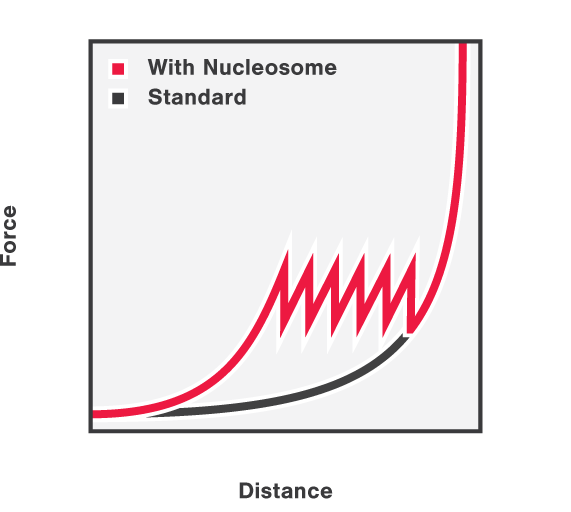
First, the DNA-histone complex is gradually extended while simultaneously measuring the force and extension. This results in the generation of a force-distance curve which provides information about the winding and unwinding of DNA around the histones with basepair resolution. Figure 3 shows that the force drops as the DNA unwinds from the histone complexes and that the DNA unwinds from the histone complexes consecutively.
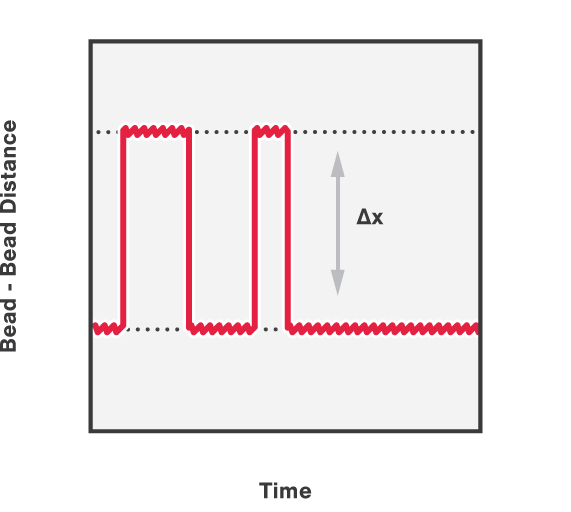
In addition, we can follow and calculate the activity of DNA organization proteins over time. This is done by applying a constant force on the DNA while simultaneously measuring the distance between the two beads. Figure 4 shows the (un)winding of DNA around histones, measured by the shortening and lengthening bursts of the end-to-end distance between the two beads.
Visualization of DNA-protein interactions
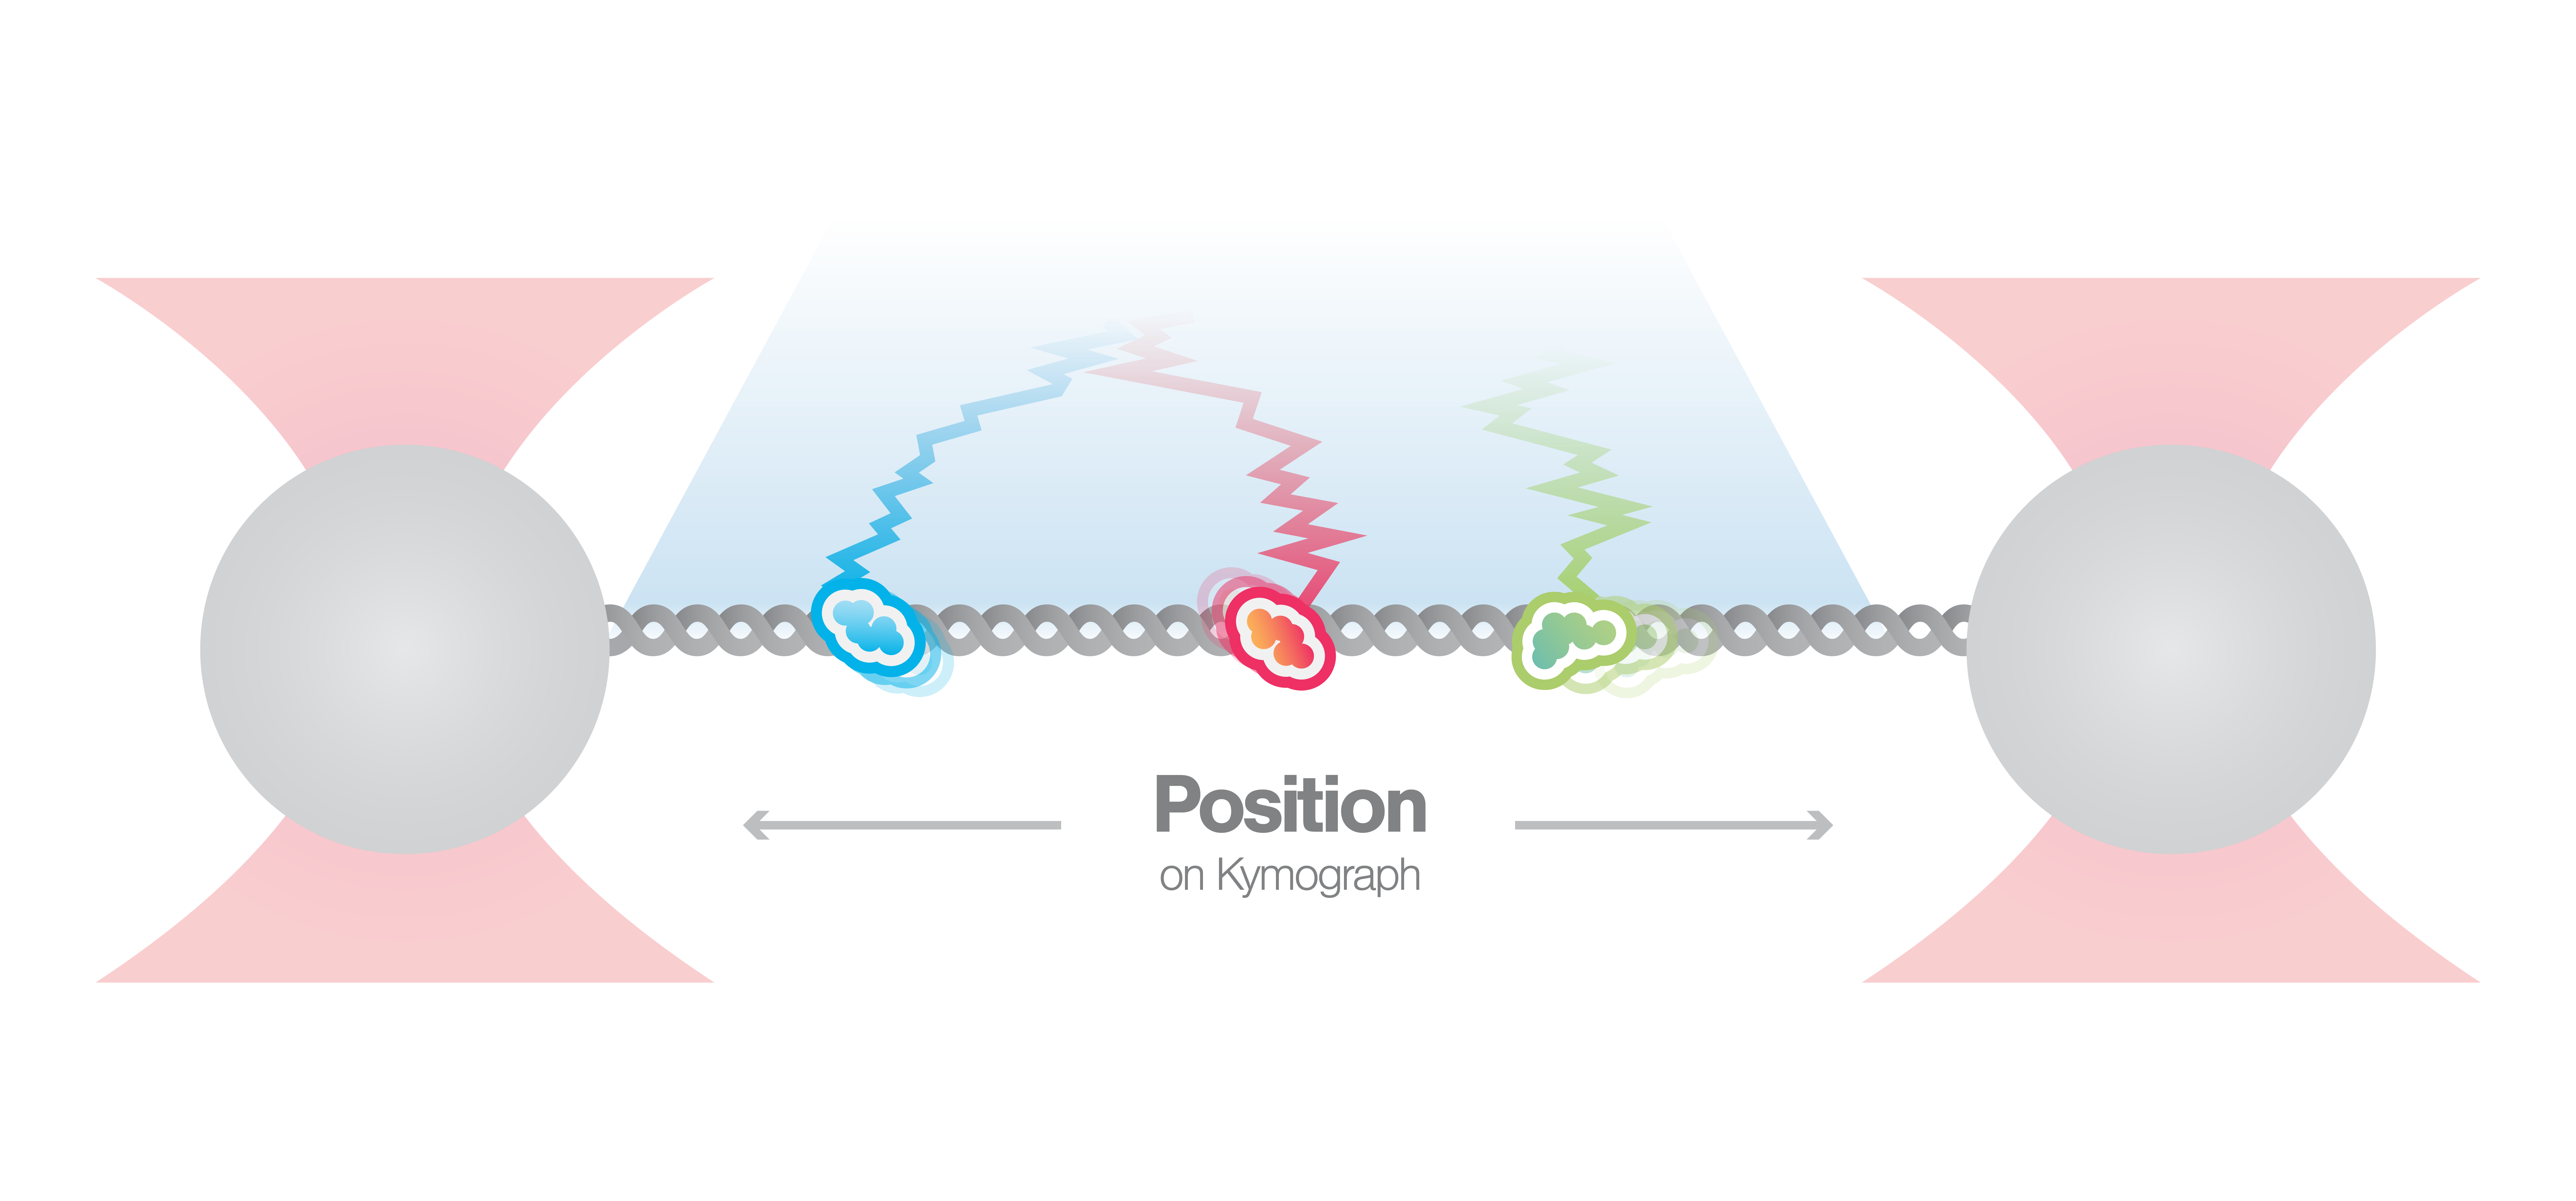
In this experiment, a DNA molecule is tethered between two beads while multiple fluorescently labeled proteins are interacting with it. We can visualize these interactions and track them over time using multicolor confocal or STED fluorescence microscopy. The resulting kymograph unveils the number, position, diffusion, and (un)binding events of the proteins along the DNA.
The kymograph in Figure 5 shows the position of bound XRCC4 and XLF on DNA over time at protein concentrations of 5 nM. These are two repair proteins involved in non-homologous end-joining which can associate with each other to form complexes capable of bridging DNA. From the figure we can observe and quantify the dynamics (N=94 events) of XRCC4 (green, 9%), XLF (red, 62%), and XRCC4-XLF complexes (yellow, 29%).
The kymograph gives real-time insights in the DNA-protein interactions and protein-protein interactions involved in DNA repair. Simultaneous force and extension measurements allow correlating the protein activity and binding kinetics with the mechanical properties of the protein-DNA complex.
5 Kymograph showing the dynamics of XRCC4 (green), XLF (red), and XRCC4-XLF complexes (yellow) on DNA.
Brouwer et al. (2016) Nature
Force extension, manipulation, and visualization of DNA-protein-DNA interactions
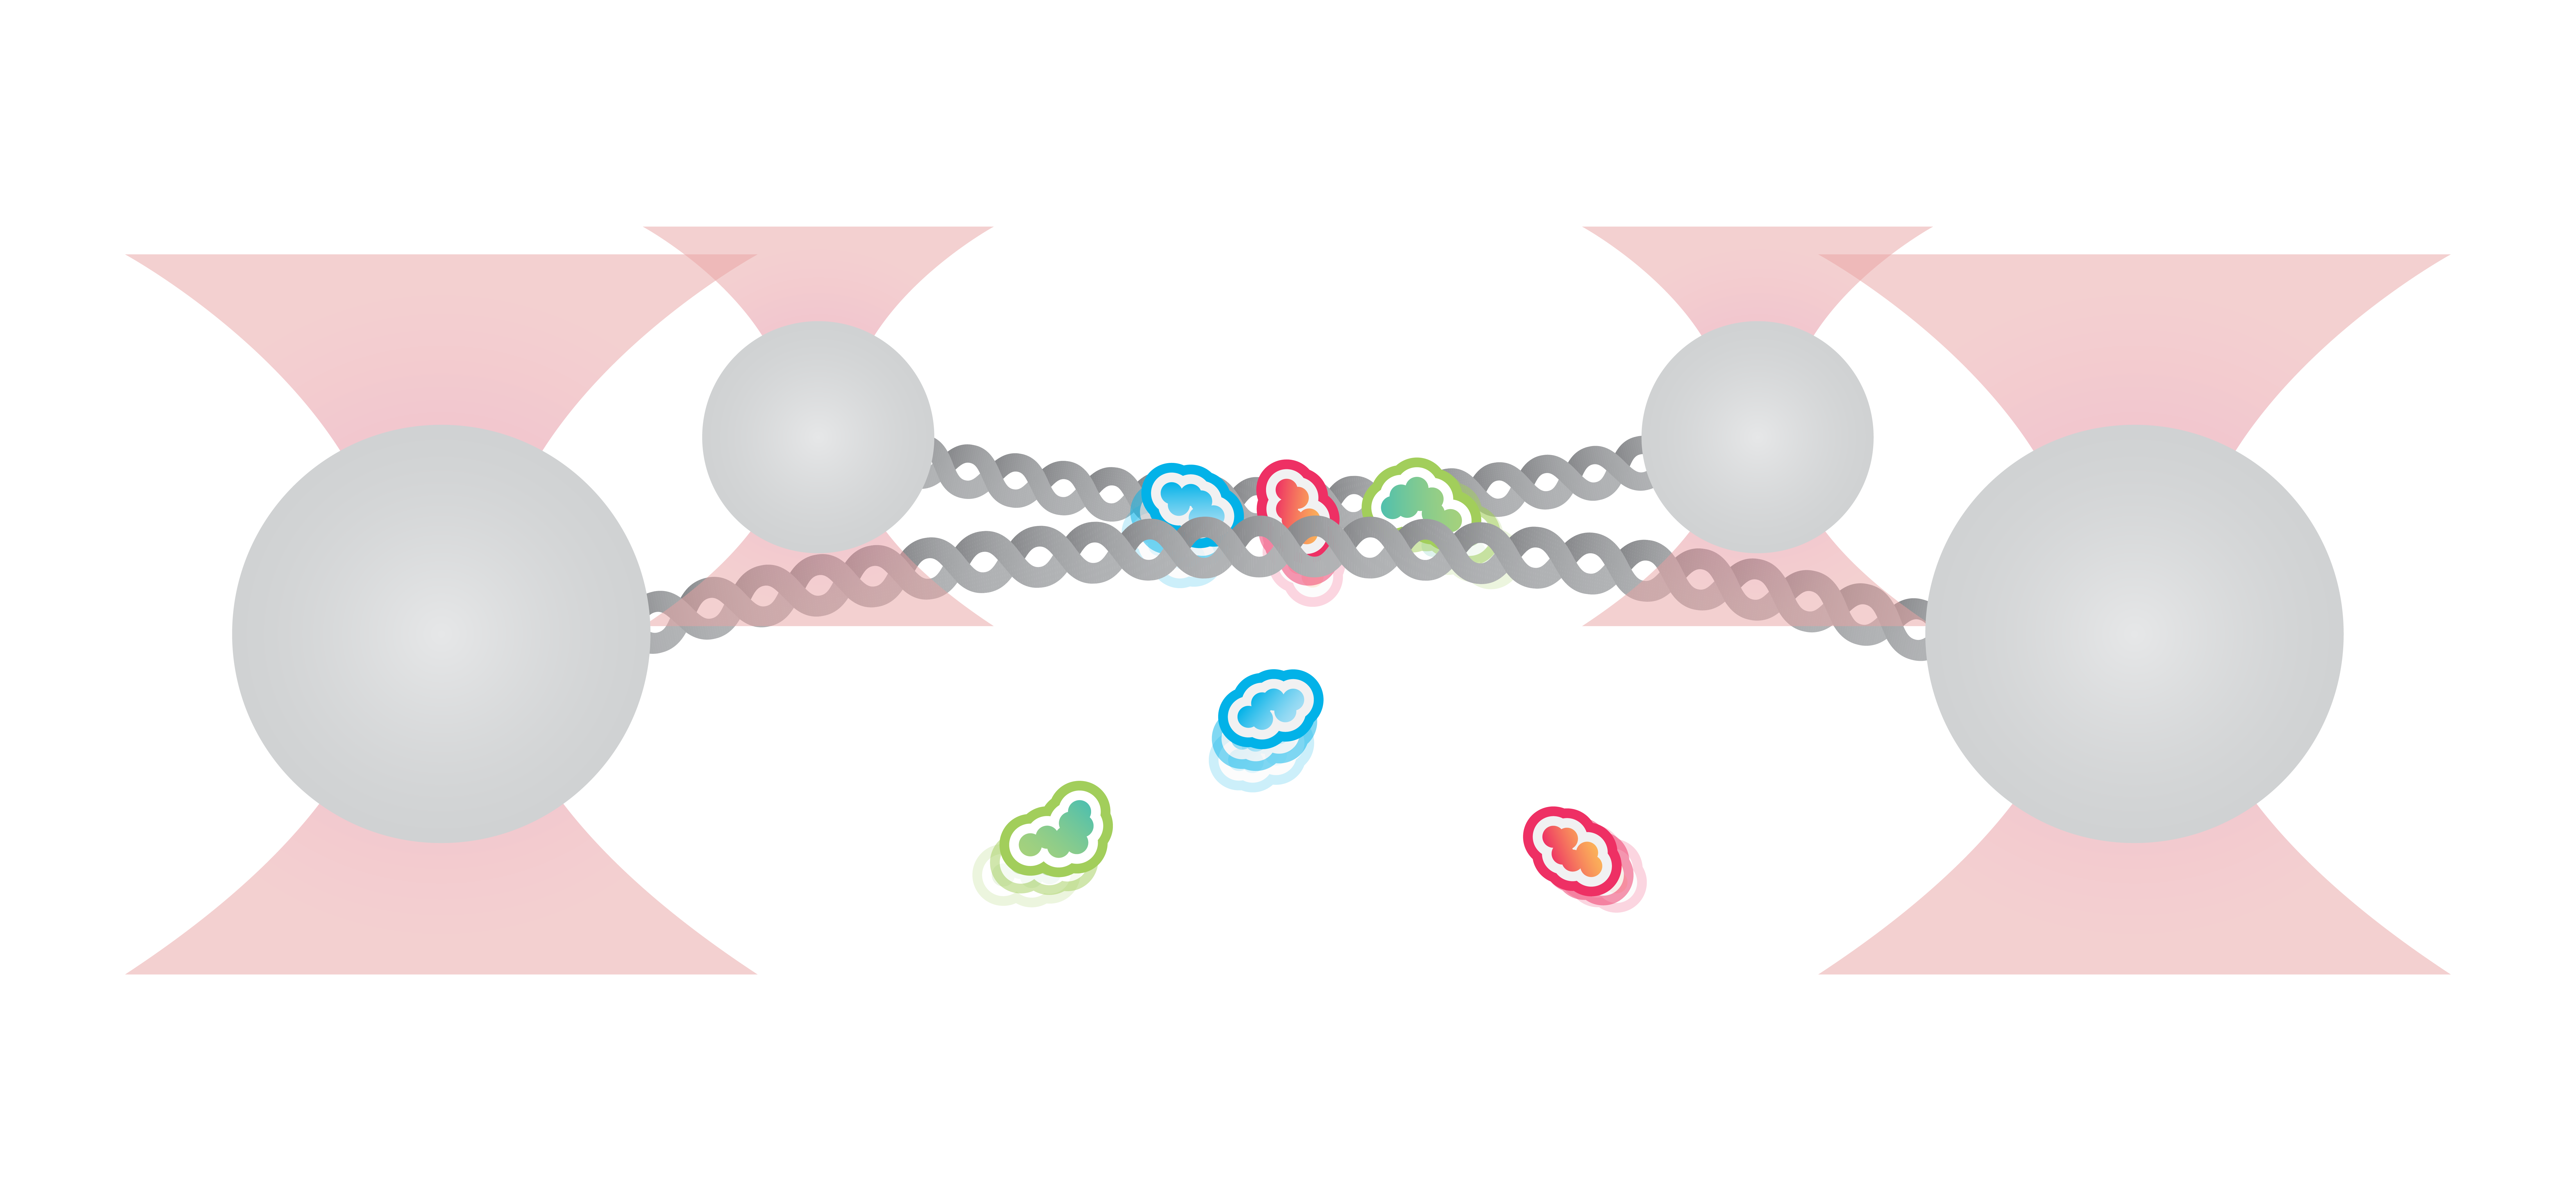
Here we use a quadruple trap configuration to trap beads and catch two DNA molecules in between. The two DNA molecules are held in close proximity in the presence of DNA bridging proteins. This allows for the study of complex DNA interactions involving multiple DNA molecules.
Figure 6 shows an example in which two DNA molecules are trapped using four optical traps and incubated with 200 nM of XRCC4 and 200 nM of XLF. As we increase the distance between the two trap pairs, we can observe the formation of protein bridges (orange), consisting of both XRCC4 (green) and XLF (red).
We can further manipulate the beads with force to further validate bridge stability and study the behavior of proteins under tension. In addition, by pulling on one bead, we can disrupt the bridges in a controlled manner resulting in a stepwise length (L) increase between the upper and lower beads (Figure 7). In the figure, the length increases shown are the result of disrupting DNA bridges by pulling on one side of the beads.
Brouwer et al. (2016) Nature

